From Paper-Based Records to Digital Transformation
Early clinical trials relied entirely on paper-based case report forms (CRFs) and manual records. Patient data were recorded by hand, and summaries, or “profiles,” were manually compiled by clinical monitors or data managers. This process was time-consuming, prone to errors, and made real-time decision-making almost impossible.
The Convergence of Clinical Research and Business Intelligence
Although clinical research and business intelligence initially developed as separate fields, their convergence has shaped the way clinical data is now managed and visualized. The evolution of BI technologies has influenced the development of modern clinical trial dashboards, which now resemble business intelligence platforms more than traditional biomedical reports. Instead of static, text-based documents, clinical data is increasingly presented in interactive formats, incorporating dynamic charts, real-time analytics, and patient-specific visualizations.
The Rise of Comprehensive and Integrated Patient Profiles
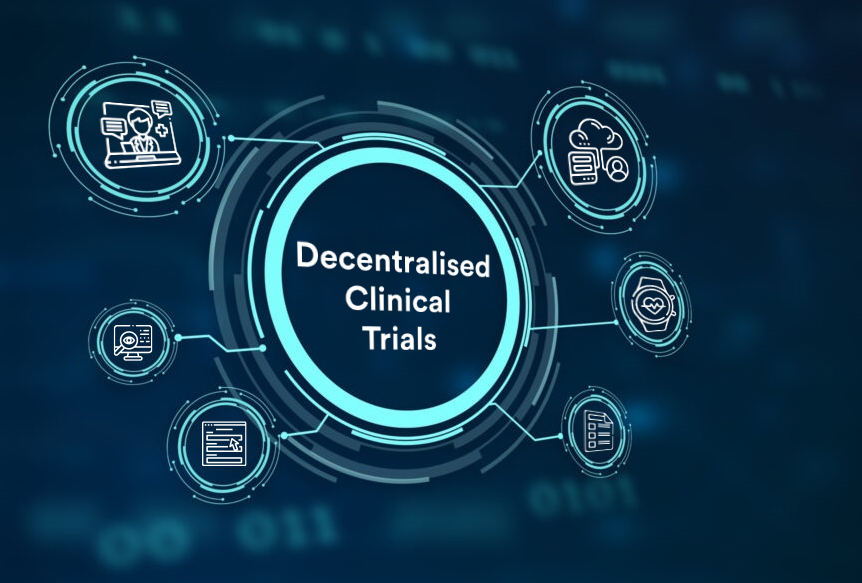
With improved data capture and storage capabilities, clinical trial systems have progressed to generate comprehensive patient profiles that combine personal information, medical history, laboratory values, and treatment outcomes. These profiles have become invaluable tools for monitoring patient safety and assessing treatment efficacy. Indeed, these advancements triggered the shift toward decentralized trials which has heightened the demand for integrated patient data systems. Robust patient profiles facilitate remote data capture and monitoring, making them essential in decentralized environments.
Integration of Clinical Data Sources and Systems
Advances in technology have further enabled the integration of clinical trial management systems with electronic health records (EHRs), patient-reported outcomes (ePRO), wearable device data, and traditional clinical assessments.
Real-Time Dashboards for Proactive Decision-Making
The shift toward dynamic dashboards and visualization tools has empowered clinicians and data managers to interact with patient profiles in real-time, enabling faster decision-making and proactive safety monitoring. Indeed, Safety Data Review Committee meeting utilize these reports to support their discussions as they can access patient information easily.
From Static Reports to Interactive Visualizations
Traditionally, patient profiles were developed as static reports, consisting of booklets of tables and listings that structured clinical data on a patient-by-patient basis. These reports were typically generated through SAS programming and presented in PDF format. While useful, they lacked the flexibility and interactivity that modern users demand. As clients have sought more dynamic, study-specific, and visually intuitive reports, the industry has moved toward graphical representations of patient data.
The Role of Artificial Intelligence and Risk-Based Quality Management
Taking advantage of advancements in business intelligence, clinical research has transitioned from manual data processing to sophisticated AI-driven analytics, bridging the gap between clinical and business intelligence for more efficient and insightful patient data management. This evolution has even allowed CROs and Pharma to evaluate the risks associated with data reporting, i.e. can I detect a site misreporting adverse events for an early phase trial by comparing the historical adverse event reporting trends in the disease? This new field combining clinical trials and risk management, the so called Risk Based Quality Management can be supported by Patient Profiles as they nowadays include how the clinical data reported for a specific patient matches with the overall reporting trends for specific assessments, e.g. are these hepatic function lab markers in line with the whole population enrolled.
MEDIA CONTACT
Ms. Natalia Farr
natalia.farr@pivotalcr.com